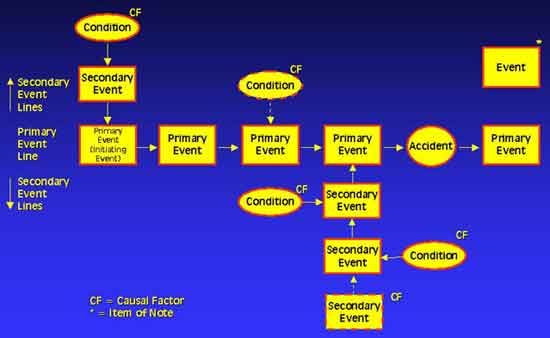
Event and causal factor charting is a written or graphical description for the time sequence of contributing events associated with an accident. The charts produced in event charting consist of the following elements:
Condition. A distinct state that facilitates the occurrence of an event. A condition may be equipment status, weather, employee health, or anything that affects an event.
Event. A point in time defined by a specific action occurring.
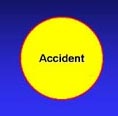
Accident. Any action, state, or condition in which a system is not meeting one or more of its design intents. Includes actual accidents and near misses. This event is the focus of the analysis.
Primary event line. The key sequence of occurrences that led to the accident. The primary event line provides the basic nature of the event in a logical progression, but it does not provide all of the contributing causes. This line always contains the accident, but it does not necessarily end with an accident event. The primary event line can contain both events and conditions.
Primary events and conditions. The events and conditions that make up the primary event line.
Secondary event lines. The sequences of occurrences that lead to primary events or primary conditions. The secondary event lines expand the development of the primary event line to show all of the contributing causes for an accident. Causal factors are almost always found in secondary event lines, and most event and causal factor charts have more than one secondary event line. Note that the secondary event lines can contain both events and conditions.
Secondary events and conditions. The events and conditions that make up a secondary event line.
Causal factors. Key events or conditions that, if eliminated, would have prevented an accident or reduced its effects. Causal factors are such things as human error or equipment failure, and they commonly include the following:
Items of note. Undesirable events or conditions identified during an analysis that must be addressed or corrected but did not contribute to the accident of interest. These are shown as separate boxes outside the event chain.
Limitations of Event and Causal Factor Charting
Although event charting is an effective tool for understanding the sequence of contributing events that lead to an accident, it does have two primary limitations:

1.0 Gather and organize data. Collect known data for actors associated with the accident. An actor is a person, parameter, or object that has an action in the event chain. Organize the data into a timeline. Review data for consistency and gaps. This step is not always necessary for simple events.

2.0 Select the accident. Define the accident of interest. If there is more than one accident, choose the last one to occur.

3.0 Define the primary sequence of events leading to the accident. Outline the thumbnail sketch of the sequence of events leading to the accident. Work backward from the accident, making certain that each subsequent event is the one that most directly leads to the previous event.

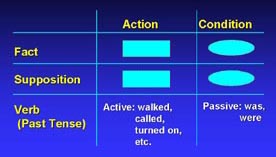
Draw events using the guidance in the table and bullets below.

4.0 Complete the model by adding secondary events and conditions. Add secondary events and conditions as appropriate to ensure that all events and conditions leading to an accident are sufficient and necessary to cause the accident. Add events as appropriate to display the contributors to the secondary events and conditions.

5.0 Identify causal factors and items of note. Designate the underlying contributors to the accident as causal factors. Document any items of note.
The following is an example accident scenario and the resulting event and causal factor chart.
Example
A barge carrying gasoline and diesel ran aground in an environmentally sensitive area. The accident was a spill of 1,500 gallons of gasoline and 120 gallons of diesel fuel into a bay, which is an especially sensitive environmental area. This accident was described as "gasoline and diesel spill continued (1,500 gallons of gasoline and 120 gallons of diesel)," and it is shown on the second page of the event and causal factor chart that follows. The chart traces the sequence of events from the initiating event as the barge got under way through the grounding event, which resulted in the gasoline and oil spill. The chart continues to trace the sequence of events from the initial oil spill through spill identification, response, and control actions implemented by both the Coast Guard and local authorities. The event chart identifies 10 causal factors judged to be significant contributors to the accident. The event and causal factor chart also identifies one item of note revealed during the investigation.
Source: USCG Risk-based Decision-making (RBDM) Guidelines.
Copyright ©2000-2015 Geigle Safety Group, Inc. All rights reserved. Federal copyright prohibits unauthorized reproduction by any means without permission. Students may reproduce materials for personal study. Disclaimer: This material is for training purposes only to inform the reader of occupational safety and health best practices and general compliance requirement and is not a substitute for provisions of the OSH Act of 1970 or any governmental regulatory agency. CertiSafety is a division of Geigle Safety Group, Inc., and is not connected or affiliated with the U.S. Department of Labor (DOL), or the Occupational Safety and Health Administration (OSHA).